- Mind Expanding Ideas
- Posts
- Capital Readiness in ConTech: Benchmarks Every Founder Needs Before Their First Raise
Capital Readiness in ConTech: Benchmarks Every Founder Needs Before Their First Raise
Key Metrics for a Capital Raise
Ty Waters
July 10, 2025
Introduction
Preparing for your first institutional raise as a ConTech SaaS founder means more than polishing your pitch deck, it requires demonstrating that your business operates at investor-grade performance levels. Capital readiness hinges on a handful of core metrics that signal efficiency, growth potential, and risk management. Below, we unpack the key metrics every founder must know, share benchmark data drawn from industry-leading sources, and offer a simple self-assessment framework. Finally, we’ll show how J. Waters AI can help you turn raw numbers into a compelling, data-driven fundraising narrative.
Key Metrics for Capital Readiness
Burn Multiple
Definition: Net burn divided by net new ARR over a given period.
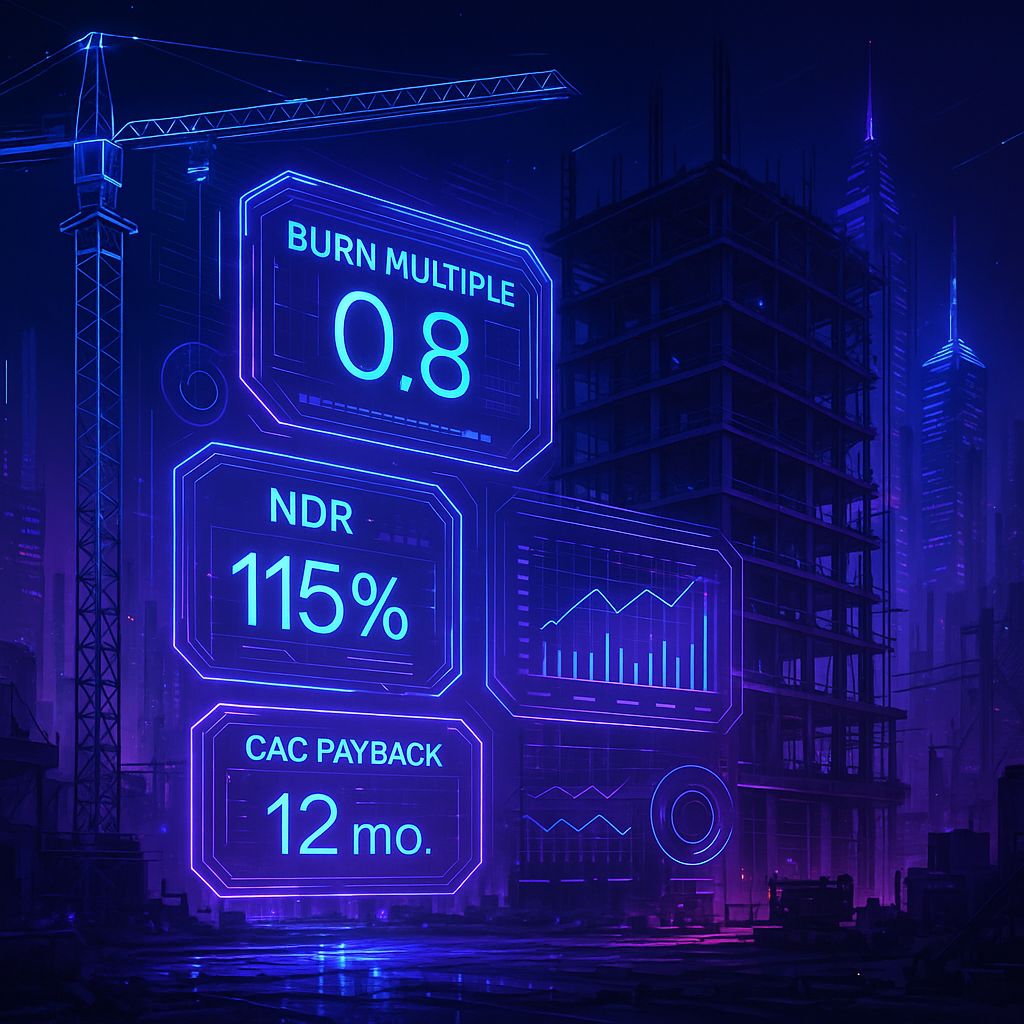
Why it matters: Shows how efficiently you’re translating cash burn into revenue growth; investors look for a burn multiple below 1.0 in high-growth scenarios (Bessemer Venture Partners, 2025).
Net Dollar Retention (NDR)
Definition: The percentage of recurring revenue retained from existing customers, including expansions and churn.
Why it matters: Demonstrates customer satisfaction and expansion potential; top-quartile SaaS companies often exceed 115% NDR (SaaS Capital, 2025).
CAC Payback Period
Definition: Time required to recoup Customer Acquisition Cost through gross margin–adjusted revenue.
Why it matters: Reflects sales & marketing efficiency; sub-12-month payback is generally considered healthy for seed-stage SaaS (OpenView Partners, 2025).
Customer Acquisition Cost (CAC) Ratio
Definition: ARR added in a period divided by sales & marketing spend in that same period.
Why it matters: Quantifies return on growth investments; a ratio above 1.0 indicates you’re earning more in revenue than you spend to acquire it (OpenView Partners, 2025).
Gross Margin
Definition: (Revenue – Cost of Goods Sold) ÷ Revenue
Why it matters: Ensures scalability and fund deployment flexibility; ConTech SaaS businesses typically target >70% gross margin (Bessemer Venture Partners, 2025).
Runway (Months)
Definition: Cash on hand divided by monthly net burn.
Why it matters: Indicates how long you can operate before needing new capital; 12–18 months of runway is standard before raising.
Benchmark Data
Metric | Top Quartile Benchmark | Source |
Burn Multiple | < 1.0 | Bessemer Venture Partners (2025) |
Net Dollar Retention (NDR) | ≥ 115% | SaaS Capital (2025) |
CAC Payback Period | ≤ 12 months | OpenView Partners (2025) |
CAC Ratio | ≥ 1.0 | OpenView Partners (2025) |
Gross Margin | ≥ 70% | Bessemer Venture Partners (2025) |
Runway | 12–18 months | Internal ConTech SaaS benchmark |
Self-Assessment Framework
Use the questions below to gauge where you stand:
Burn Efficiency
Have you calculated your burn multiple for the last 12 months?
If above 1.0, which levers (pricing, upsells, cost structure) can you tweak?
Revenue Stability & Expansion
Is your NDR trending above 100%?
If not, what upsell, or retention initiatives could boost account expansion?
Customer Acquisition Efficiency
How many months does it take to recoup your CAC?
Could you refine your targeting or sales process to shorten payback?
Profitability Levers
Is your gross margin at or above 70%?
Are there ways to optimize hosting, support, or delivery costs?
Runway Planning
Do you have at least 12 months of runway at current burn?
If the runway is tight, where could you pause hiring or reduce discretionary spend?
Once you’ve answered these, plot each metric on a simple scorecard green (on-target), yellow (needs improvement), or red (high-risk). This visual helps prioritize which areas to address before fundraising.
How J. Waters AI Empowers Your First Raise
Automated Metric Calculation
J. Waters AI ingests your uploaded financials and automatically computes burn multiple, NDR, CAC payback, and more eliminating manual spreadsheet errors.
Benchmark Comparison
Your metrics are instantly benchmarked against aggregated ConTech SaaS data from Bessemer Atlas, OpenView, and SaaS Capital, so you know exactly how you stack up.
Blind-Spot Identification
The platform highlights where you’re underperforming relative to peers and suggests targeted actions—whether it’s a retention play to boost NDR or a pricing adjustment to improve CAC payback.
Investor-Grade Insight Summaries
J. Waters AI translates raw numbers into narrative insights with investor-ready language, framing your story around efficiency gains, growth milestones, and capital deployment strategy.
Customized Capital Strategy
Based on your package, you receive a step-by-step roadmap detailing which metrics to optimize first, how to sequence fundraising conversations, and which investor profiles are best aligned with your readiness level.
By combining advanced data analysis with deep ConTech benchmarks, J. Waters AI turns your financials into a strategic asset maximizing confidence for both you and your future investors.
References
Bessemer Venture Partners. (2025). Atlas: SaaS benchmarking data. Retrieved from https://www.bvp.com/atlas
OpenView Partners. (2025). SaaS benchmarks report. Retrieved from https://openviewpartners.com/about/
SaaS Capital. (2025). SaaS benchmarking survey 2025. Retrieved from https://www.saas-capital.com/benchmarking
Reply